4 Types of Business Analytics for Better Decision Making
Learn the 4 key types of data analytics to uncover insights, make accurate predictions, and drive smarter business decisions with confidence.
Contact Us
Many organizations still make decisions based on assumptions instead of accurate data. Without proper analytics, they struggle to identify key performance factors, predict future trends, or respond effectively to market changes. This leads to missed opportunities and limits business growth.
That’s where business analytics comes in. It helps you make sense of the data and take smarter actions. This article explains the four main types of data analytics, their role in decision-making, and how companies can use them to grow and run more efficiently.
Key takeaways
What Is Business Analytics and Why Does It Matter?
Business analytics is the structured study of data to generate insights that guide decisions. Instead of guessing, organizations use analytics to understand past results, find causes, forecast outcomes, and choose the best responses, reducing poor results and improving confidence in choices.
Why it matters:
A retail chain used analytics to discover that 20% of its inventory was consistently overstocked. By adjusting procurement based on analytics, the company reduced holding costs by 15% within six months.
The Evolution of Data Analytics in Business
Reporting went from handwritten reports and spreadsheets to visual dashboards and now to AI-assisted models. New mobile and machine learning tools will not only allow companies to identify what happened, but also to predict trends and recommend action in advance. This shift requires both improved tools as well as a test-measure-learn mentality focused on data.
4 Types of Data Analytics
These four types of business analytics build on one another, delivering deeper insight and more value.
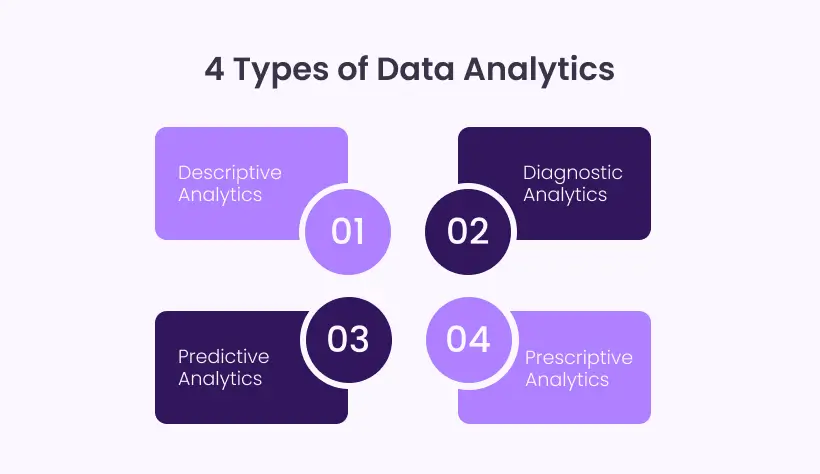
Descriptive Analytics
Descriptive analytics answers “what happened” by summarizing past facts in reports and dashboards. It tracks KPIs and trends, allowing teams to identify strong or weak areas. For example, a retail chain can review monthly sales by region to pinpoint which stores require attention. Descriptive work builds trust in data.
Diagnostic Analytics
Diagnostic analytics provides insight into the reasons "why it happened," by examining the connections and patterns of relationships. It helps identify the root cause of trends or anomalies; for example, examining a spike in subscription cancellations to discover the effect of changes in pricing, competition, or a customer group. The diagnostic analytics process reduces uncertainty and supports decisions based on evidence.
Predictive Analytics
Predictive analytics utilizes data collected from past occurrences and standard statistical estimators to predict outcomes in the future. Organizations use predictive analytics to identify customer behavior, sales, or demand. For example, a logistics company might predict seasonal demand so it would optimize its inventory handling and reduce delays. Predictive work allows an organization to be proactive and prepare for an event prior to it taking place.
Prescriptive Analytics
Prescriptive analytics proposes actions or decisions that are likely to result in the best outcomes. It produces recommendations or decisions by suggesting or automating decisions to drive a desired outcome by combining predictions, optimization, and business rules. For example, an online retailer may automatically change prices, promotions, and the placement or stock level of inventory to maximize revenue, all while continuing to protect the customer’s experience.
What are the 5 levels of use in data-driven decision making?
A simple maturity ladder companies use to measure progress:
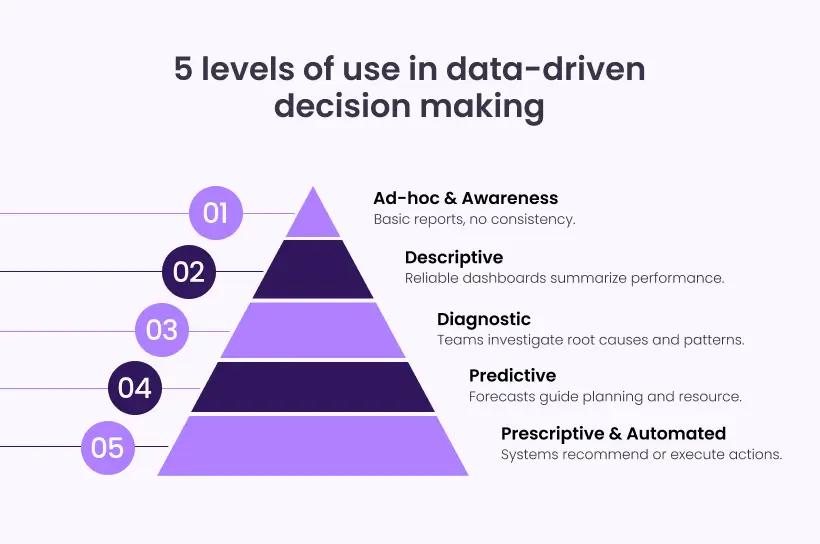
Progressing step-by-step builds skills, governance, and data quality needed for reliable decisions.
What Kinds of Data Analytics Does Your Company Need?
Choice depends on maturity and goals. New teams start with descriptive analytics to build consistent reporting. If recurring problems appear, diagnostic analytics finds root causes. For better planning and forecasts, adopt predictive analytics. For time-sensitive or high-volume operations, prescriptive analytics can recommend or automate decisions. Balance ambition with practicality: success depends on clean data, analytical skills, governance, and a willingness to act on insights.
How AI Is Applied in Business Analytics
AI and machine learning speed up preparation, strengthen predictions, and broaden access to insights. Natural-language queries and guided analytics let non-technical users ask questions and get answers. But AI’s benefits depend on clean data, strong governance, and ongoing oversight to keep results trustworthy.
Data processing and preparation automation
AI automates cleaning, matching, and transforming raw data so analysts spend less time on repetitive prep and more on insight generation.
Improving predictive and prescriptive analytics
Advanced AI uncovers subtle patterns in complex data and can combine external signals (like weather or economic indices) to improve demand forecasting or optimize supply-chain movements in real time.
Democratizing data analytics
AI-powered tools reduce barriers to analytics. Features like auto-generated insights and natural-language queries allow staff across the business to find answers quickly without deep technical skills, speeding decisions and building a data-driven culture. The biggest value of AI is scalability: it reduces manual work and frees teams to focus on higher-value strategy.
Practical Roadmap Quick Wins for Long-Term Value
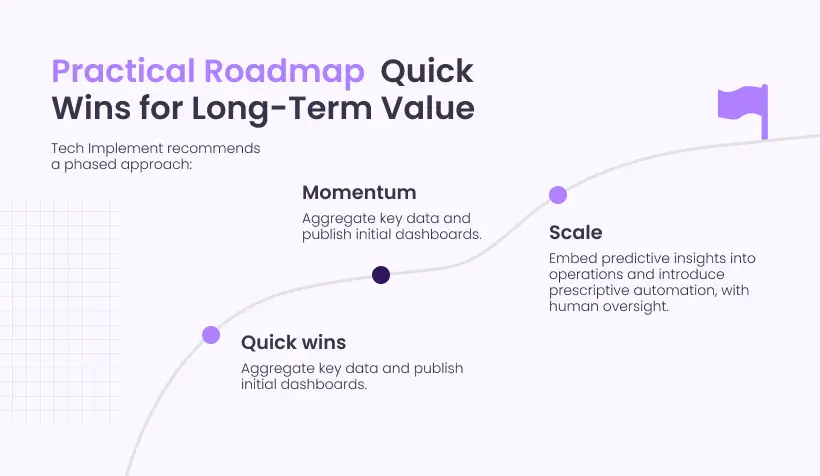
Tech Implement recommends a phased approach:
Example: a mid-sized distributor piloted demand forecasting, cut stockouts, and lowered inventory costs within six months. Phased delivery creates early value, builds trust, and lays the foundation for larger projects.
Ready to Gain Powerful Business Insights with Data?
Tech Implement helps organizations advance up the analytics maturity ladder using Microsoft Dynamics 365 and the Power Platform. Our services include roadmaps, dashboard development, predictive-model pilots, and prescriptive implementations. A partner helps ensure analytics projects meet business goals, scale across teams, and stay sustainable.
FAQs
Generally, it is enough to have 6 to 12 months of clean relevant data for most situations.
Yes. After establishing reporting and diagnostics, launch prescriptive analytics using simple automated rules. Some analytics can go a long way to improve overall productivity and competitiveness.
Dashboards can deliver value to your organization within weeks. Predictive and prescriptive projects are generally measurable after approximately 3 – 12 months from implementation, depending on the scope of the project and speed of adoption.
No. Connecting to solid data practices and having clear questions will provide more value than AI. AI is helpful later when foundational elements are resourced.
Power BI or Tableau are tools to consider for reporting. Python or R can be used for modeling. Also, a cloud platform like Azure, AWS, or Google can support scaling analytics; choose your tools based on current capabilities, skills, and integrate with the other tools needed.